
Understanding the ROI of Vending Machines for Offices
- Sep 8, 2025
- 3 min read
Updated: Sep 10, 2025

When finance teams evaluate new office amenities, the question isn’t “snacks or no snacks?” it’s: What’s the ROI, the payback period, and the ongoing cost profile? Smart vending turns an expense line into a self-funding amenity while improving employee experience and reducing pantry leakage. Below is a practical, numbers-first framework you can plug into your own assumptions.
The Finance Lens: What ROI Really Means Here
Return on investment (ROI) = (Net Profit ÷ Total Investment) × 100
Total Investment (Year 0): Machine hardware + configuration + installation.
Monthly Revenue: Avg. transactions/day × Avg. selling price × Working days.
Monthly Costs: Cost of goods sold (COGS) + restocking logistics + payment fees (UPI/RFID aggregator) + electricity + routine maintenance + software.
Payback Period: Total Investment ÷ Average Monthly Net Profit.
Tip: For offices, track cash savings from reduced pantry wastage + soft gains (reduced break drift, higher satisfaction) alongside direct vending margin.
Cost & Revenue Building Blocks (Office Context, India)
Capex (one-time):
Machine (snacks/beverages, combo, or frozen), branding, payment module (UPI (PhonePe and GPay), RFID staff wallet), initial stock.
Opex (monthly):
COGS (typically 60–75% depending on mix and subsidies).
Restocking/logistics (frequency tied to footfall).
Payment fees (as per provider), refunds/chargebacks buffer.
Energy (multi-zone cooling if applicable), routine cleaning/maintenance.
Software (vNetra monitoring, promos, OTA updates).
Revenue drivers:
Office headcount & footfall near placement.
Assortment (snacks, beverages, hygiene/OTC, fresh/frozen).
Pricing strategy (MRP, subsidized, or hybrid).
Multi-vend cart and cross-sell (drink + snack combos).
Example Scenarios
Scenario A: 300–400 seat office, lobby placement (snacks + beverages)
Users/day: 120
Transactions/day: 65
ASP (avg selling price): ₹30
Working days: 22
Revenue/month ≈ 65 × ₹30 × 22 = ₹42,900 Assume
COGS @ 68% and Other opex (logistics + payments + energy + routine care) ≈ ₹29,172 + ₹1,800 = ₹30,972
Net Profit/month ≈ ₹11,928
If capex (machine + setup) ≈ ₹1,60,000, then Payback ≈ 1,60,000 ÷ 11,928 ≈ 13.4 months
Scenario B: 700–900 seat campus, micro-market corner (multi-category)
Users/day: 350
Transactions/day: 180
ASP: ₹30
Working days: 22
Revenue/month ≈ 180 × ₹30 × 22 = ₹118,800
COGS @ 68% = ₹88,784 Other opex (more refills, energy for dual-zone, fees) = ₹3,600 And Total Cost= ₹92,384
Net Profit/month ≈ ₹26,416
If capex (machine + setup) ≈ ₹1,60,000, then Payback ≈ 1,60,000 ÷ 26,416 ≈ 6 months Year - 1 ROI ≈ 98.12%
Why the difference? Volume density, assortment breadth, and cart size (multi-vend + combos) dramatically improve ROI.
5 Proven Ways to Maximize Vending Machine ROI in Offices
Placement quality: High-traffic, high-intent zones (near cafeteria/meeting clusters) beat fringe corridors.
Assortment & planogram: Data-led planograms (top-sellers up front, slow movers trimmed) lift sell-through and reduce expiry write-offs.
Pricing strategy:
Standard: MRP-aligned for neutrality.
Subsidized: Company absorbs a % to boost adoption; track as employee welfare.
Hybrid: Full price for impulses, subsidized staples (water/healthy snacks).
UX & multi-vend: Interactive UI + cart checkout + combo prompts increase AOV and throughput.
Operations discipline: FIFO restocking, temperature discipline, clean optics, and fast ticket resolution keep revenue steady.
For More Details: https://www.vendekin.com/post/snacks-vending-machine-in-india-cost-placement-roi
How vNetra Improves the Math (and Your Sleep)
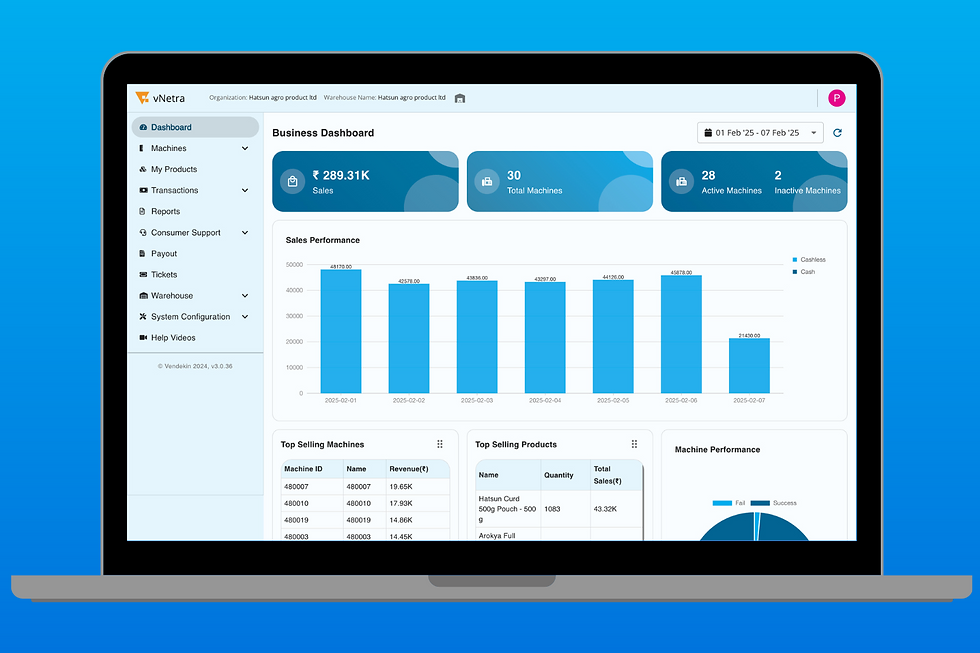
Live telemetry: Online/offline status, temperature drift, motor errors fix proactively.
Inventory intelligence: Heatmaps, sell-through alerts, and planogram suggestions; cut expiry loss.
Promo engine: Time-bound discounts, combos, wallet subsidies.
OTA control: Price updates, content, firmware fleet-wide in minutes.
Finance comfort: Clean EOD reports, UPI/RFID reconciliation, and audit trails.
Result: Higher availability, fewer service calls, tighter shrinkage control—compounding ROI.
Buy vs. Operate: Funding Models for Offices
Outright purchase (Capex): Highest control; strong ROI if traffic is predictable.
Revenue-share (Opex-lean): Operator funds capex, shares net; great for quick starts.
Hybrid/subsidy: Company subsidizes specific SKUs; track welfare cost vs. adoption gains.
Finance tip: Wherever possible, model 3 cases (conservative / expected / optimistic) and stress-test transactions/day and COGS%.
Quick Sensitivity Checks
Transactions/day − 15%: What happens to payback?
COGS +3%: Do margins still clear monthly overhead?
ASP − ₹5 (subsidy): Do adoption and output gains offset?
Refill frequency +2/week: Does logistics erode net profit?
Compliance & Controls (India)
Food safety: Temperature logs for chilled/frozen items; FIFO records.
Payments: UPI/RFID auditability; settlement reconciliation.
Electrical & safety: Earthing, MCBs, and maintenance logs for inspections.
Office ROI Checklist
Forecast footfall and transactions/day (by zone/time-band)
Choose machine form factor (combo, dual-zone, elevator for fragile)
Define pricing (MRP/subsidy/hybrid) and multi-vend combos
Map refill cadence and SOP (FIFO, expiry, cleaning)
Enable vNetra: alerts, planograms, OTA, finance reports
Set success metrics: Payback, monthly net, availability %, NPS
Review after 30/60/90 days; A/B assortment and promos
Conclusion
A well-run office vending program is a repeatable profit center. When you combine the right machine with smart placement, a data-driven product mix, and disciplined maintenance, vending machine ROI in offices reliably lands inside a 12–18 month payback band. Nail the three KPIs uptime, payment success, and stock-out minutes and the numbers look after themselves.
.


Comments